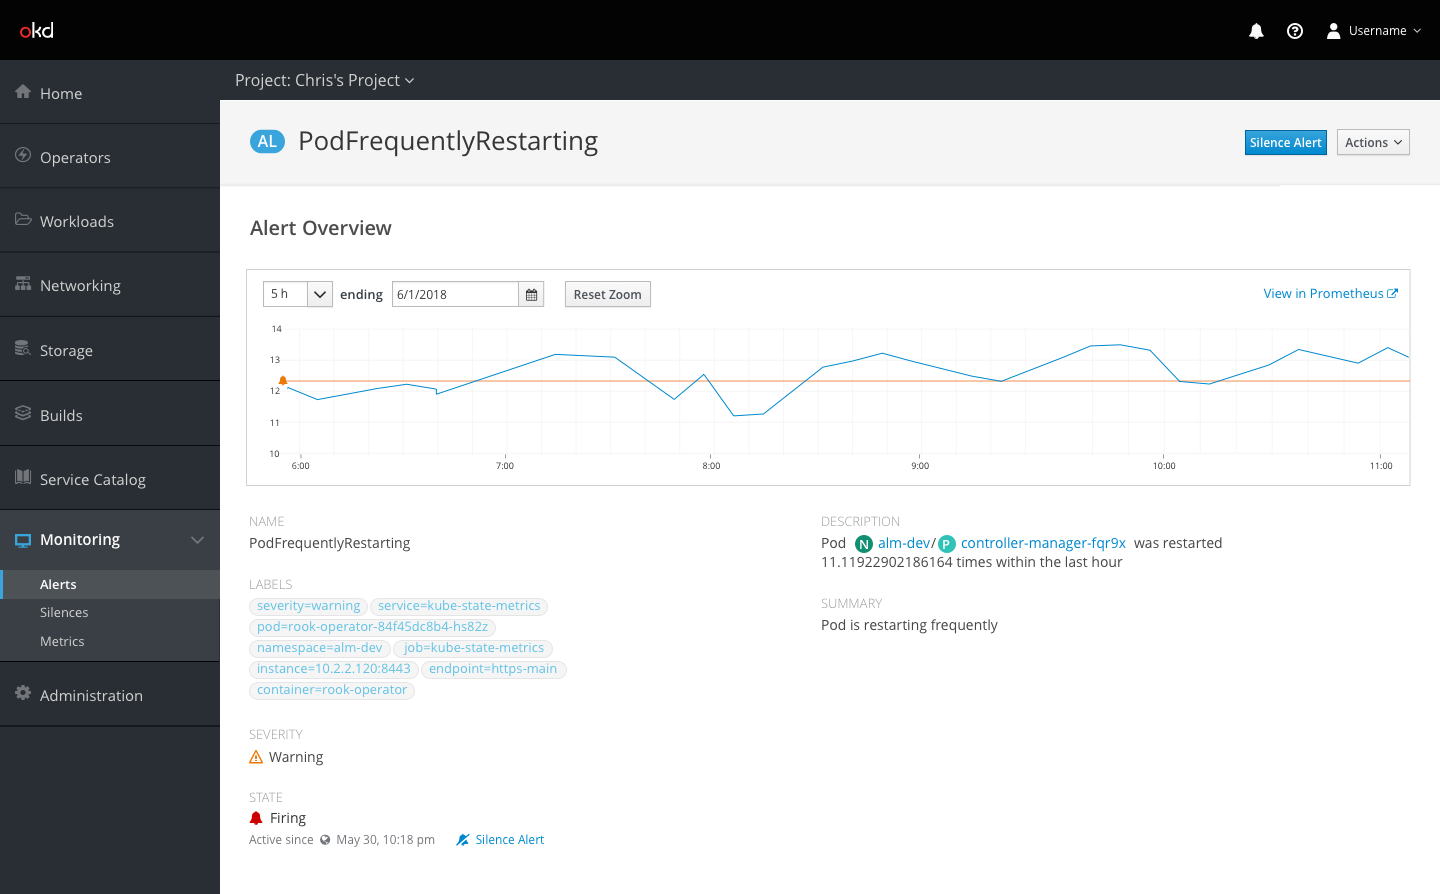
Initially the chart should be zoomed to a time period that at least includes the for attribute of the corresponding alert rule, but preferably 3-5 times that period as loading times allow. For instance the above chart shows the last hour where the metric crossed the alert threshold as well as an additional 4 hours of history
An orange line with an alert icon (if possible) shows the firing threshold for the alert
Clicking on the View in Prometheus link takes the user to the query UI pre-populated with the relevant query for the alert
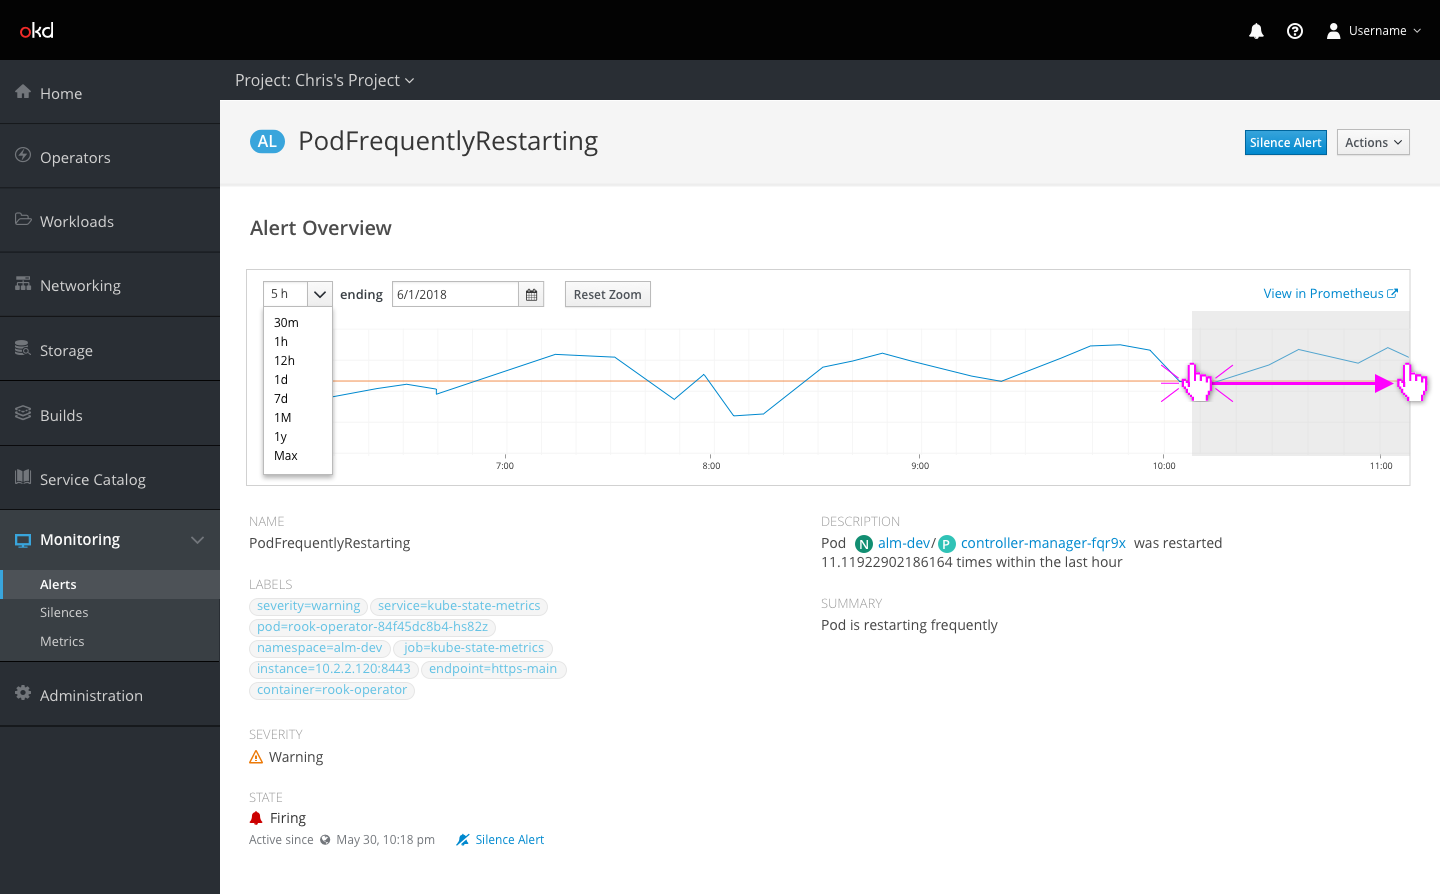
Clicking and dragging on the chart should zoom in so that the selected area fills the chart view
The zoom level of the chart can also be changed by typing a specific time period into the combobox or selecting from a number of preset time periods.
Zooming can also be done by typing or selecting a new time period above the chart
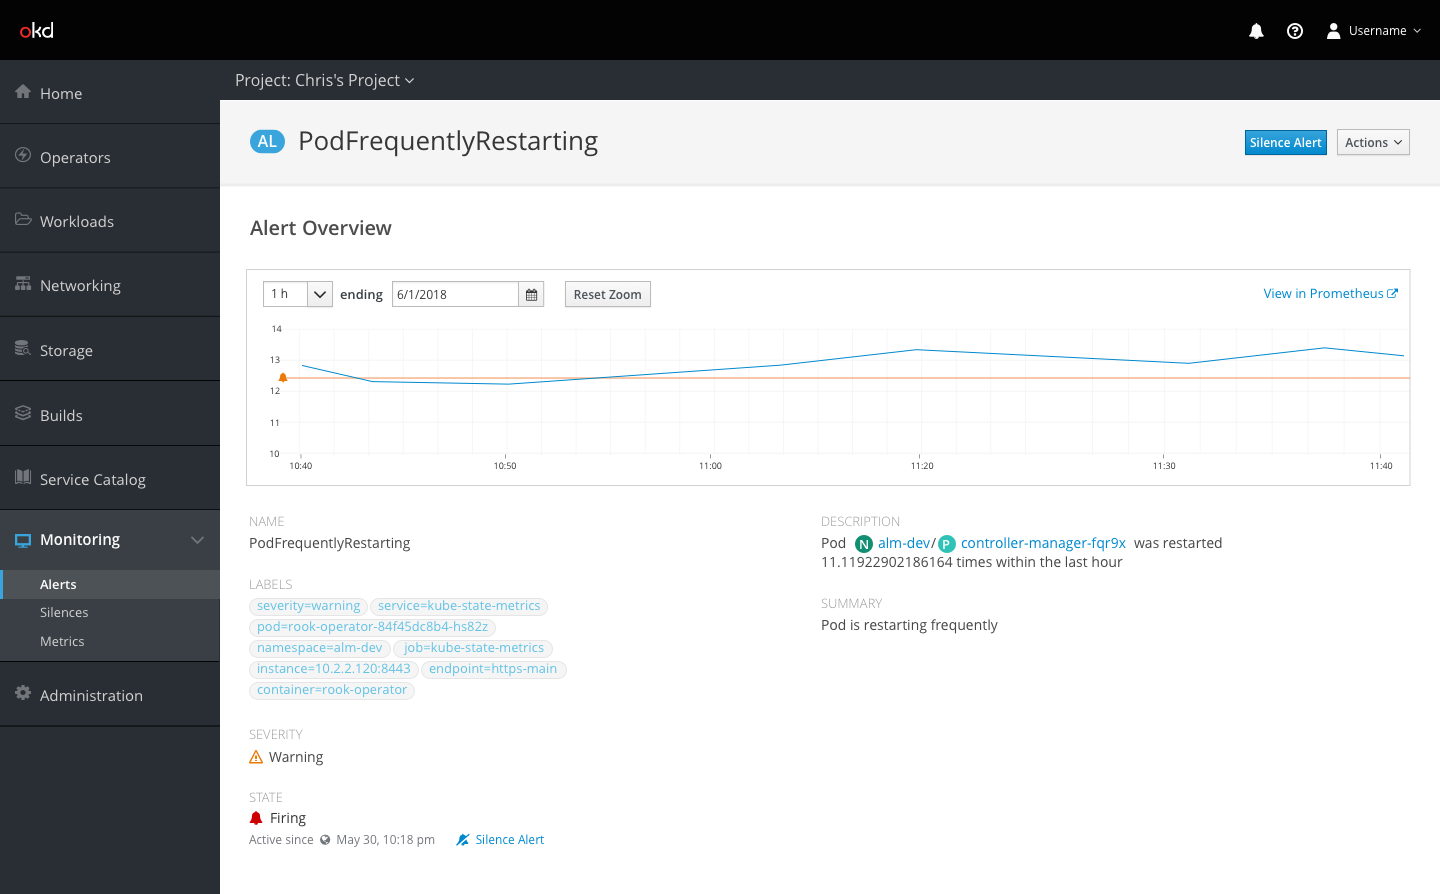
Clicking the Reset Zoom button should reset the scale of the chart to the default based on the alert
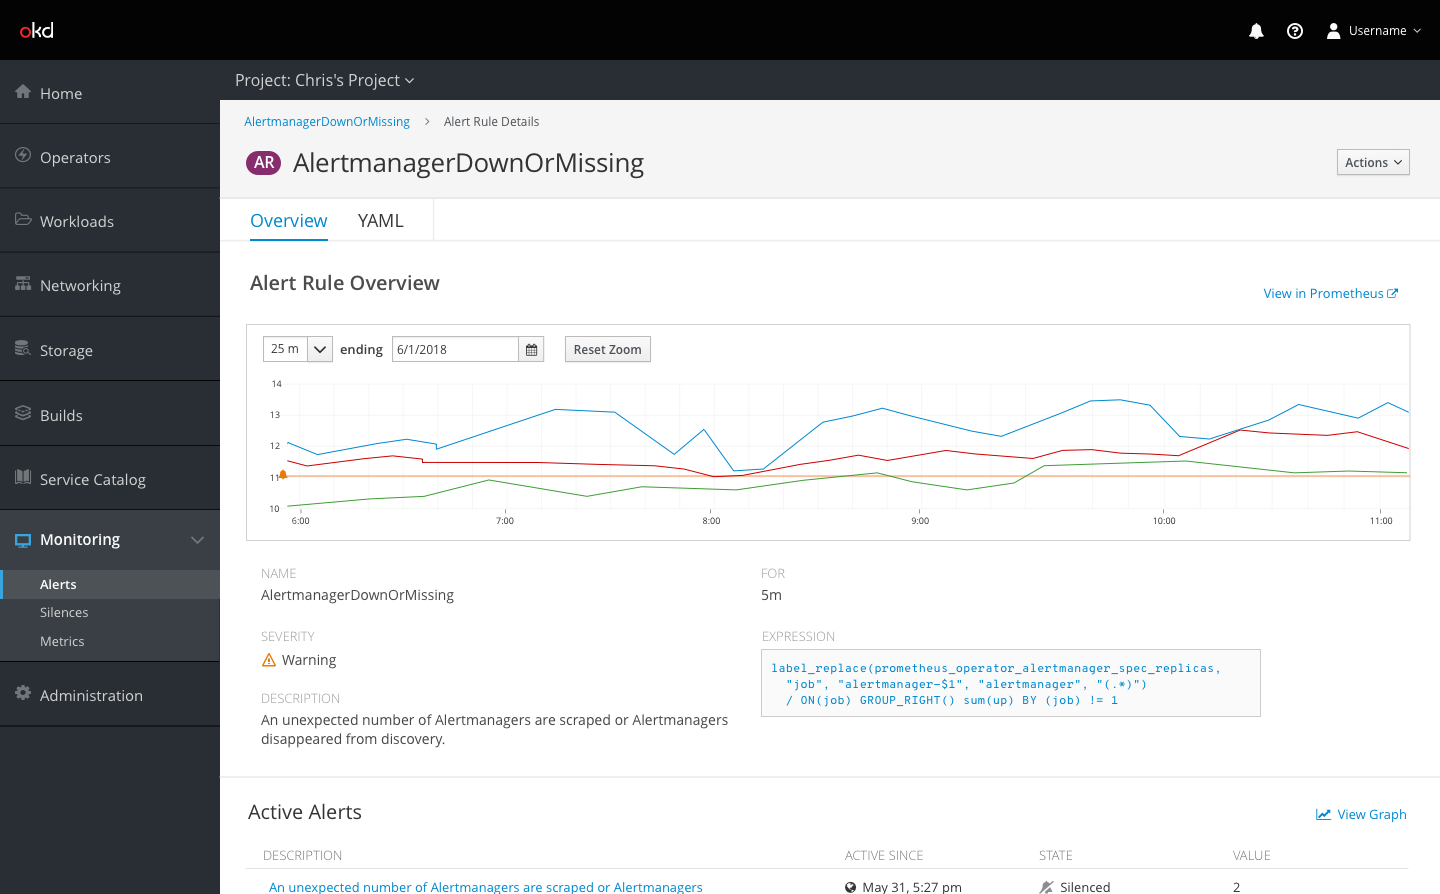
Alert Rule metrics
Alert Rule details pages contain a similar graph, but with multiple lines representing all the active alerts for that rule