parent: Administrator version: 4.8 —
**Workloads: Utilization Charts **
Reported issues:
https://issues.redhat.com/browse/PD-662
https://issues.redhat.com/browse/CONSOLE-2384
Marvel prototype (4.8 release):
https://marvelapp.com/prototype/fg10a04/screen/75532540
Background
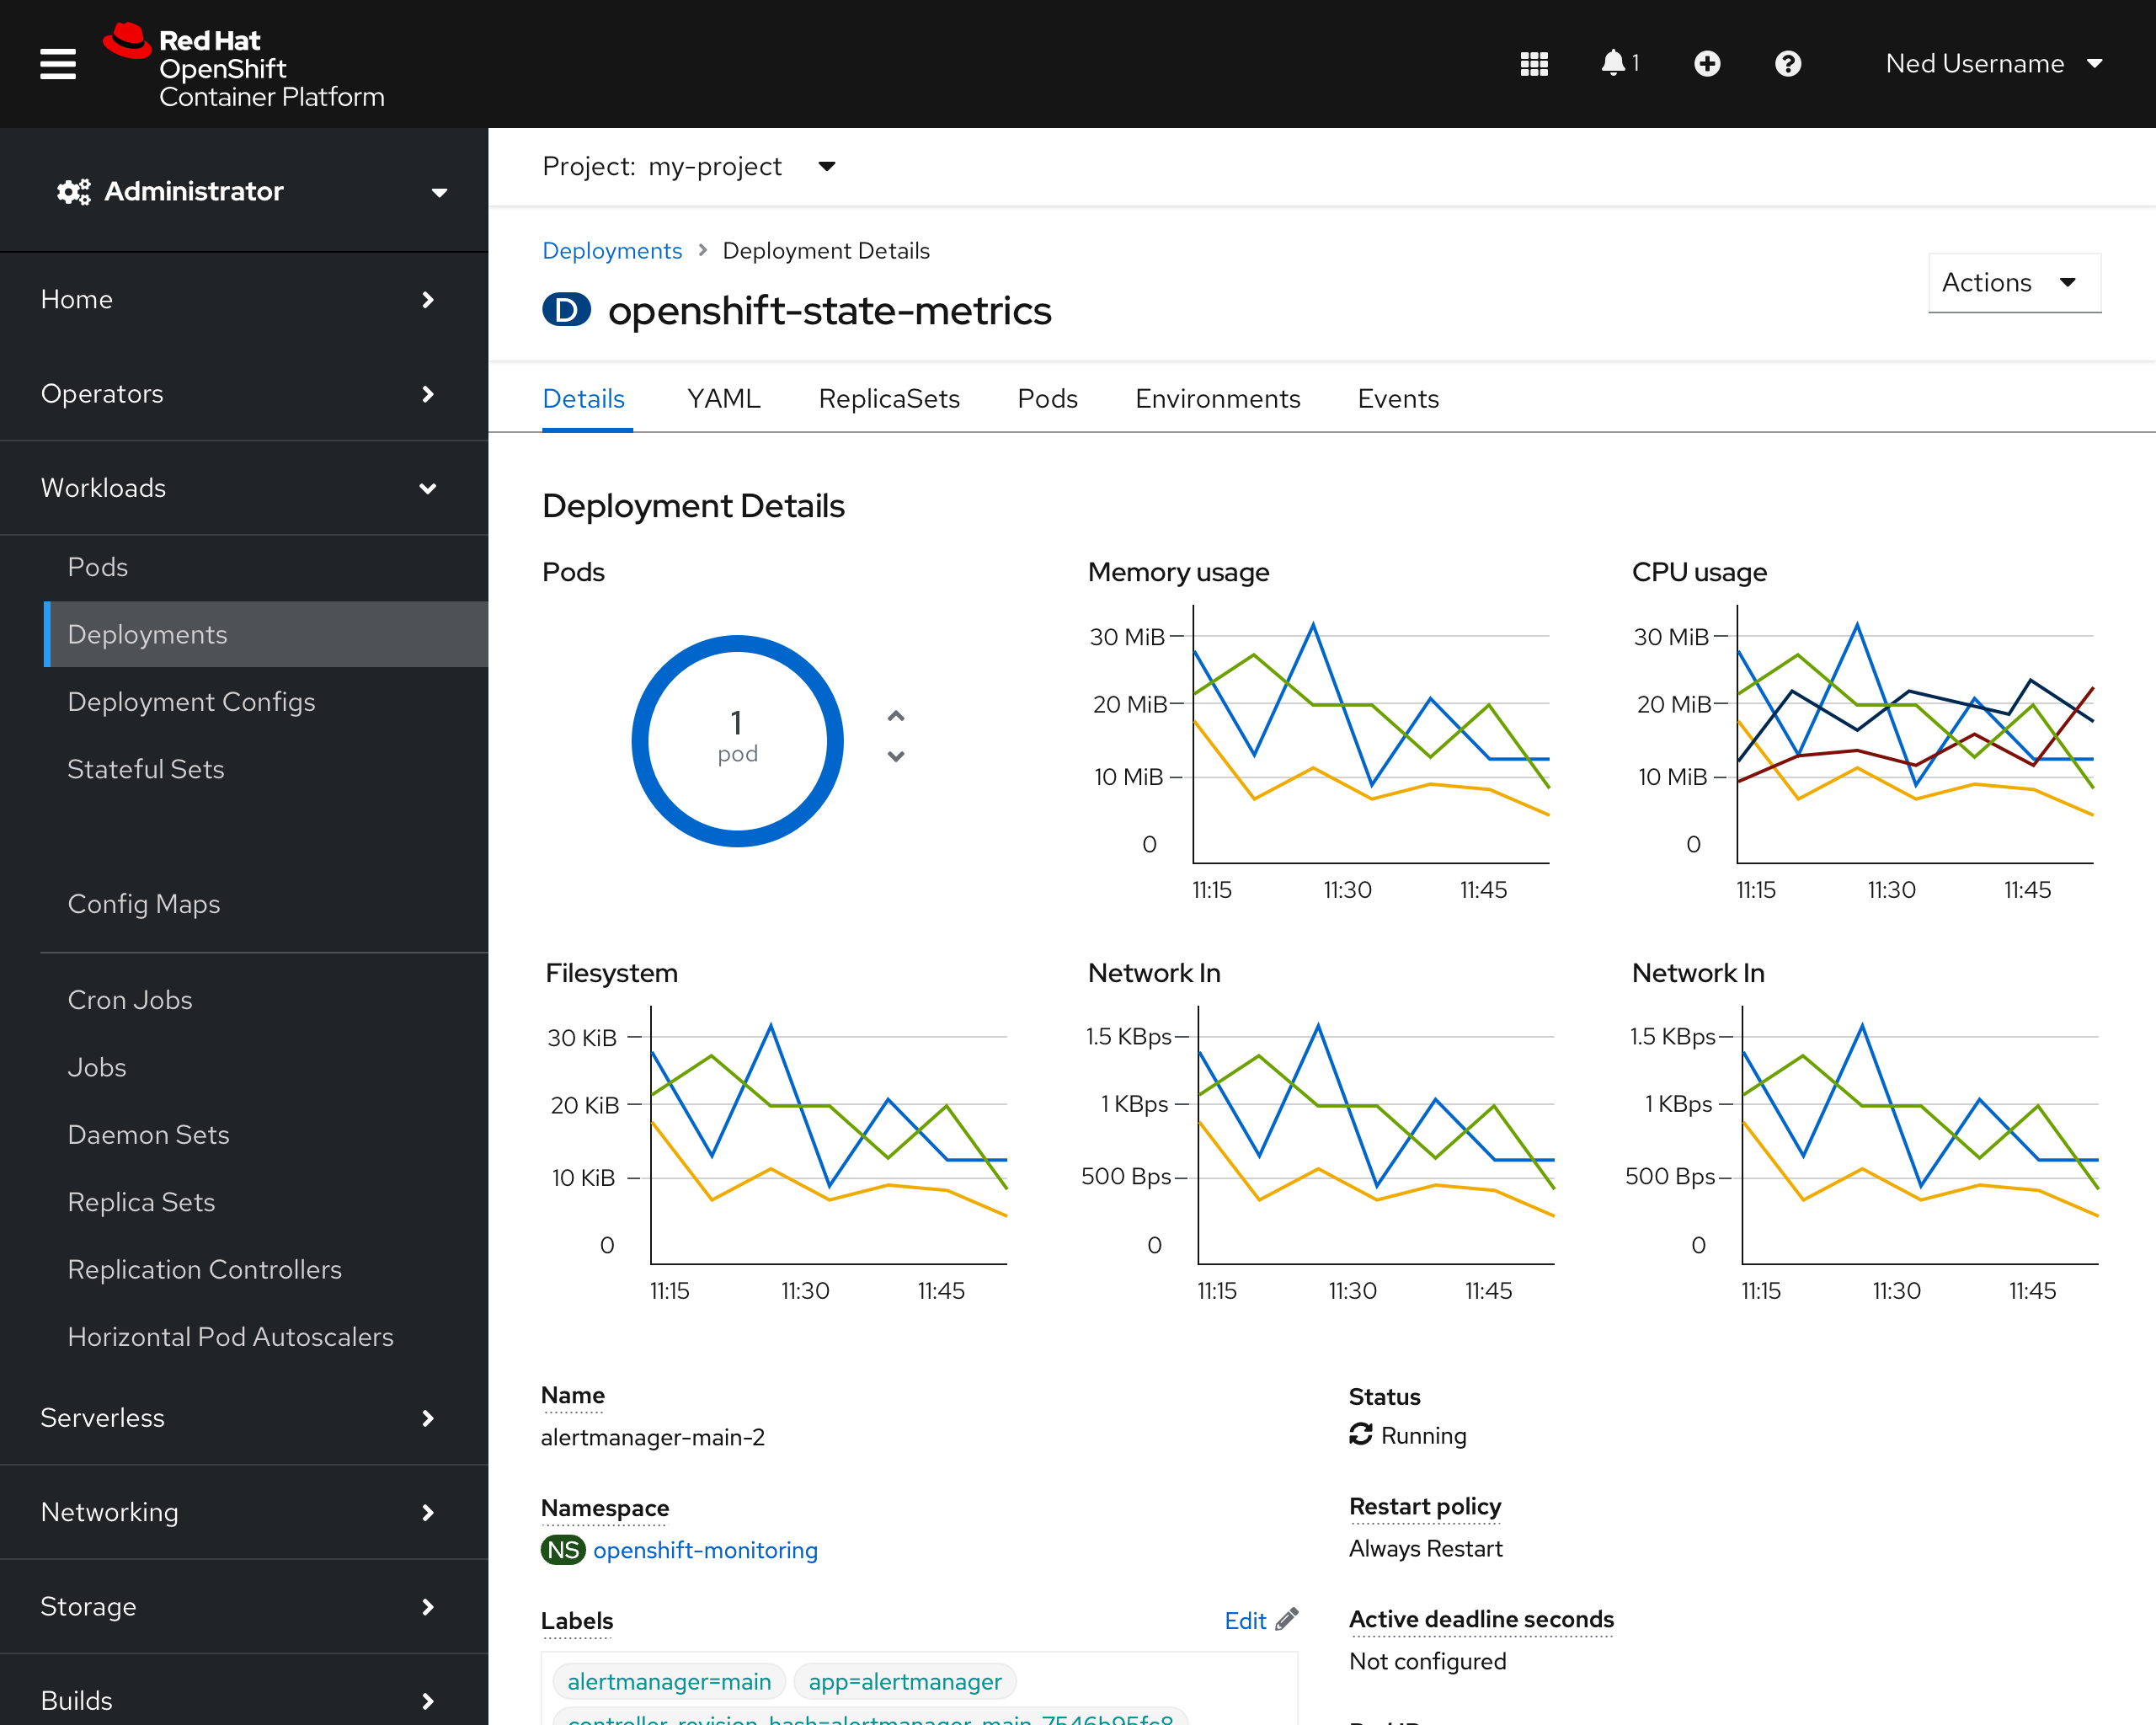
When moving to OCP 4 metrics charts for Deployments, Deployment Configs, StatefulSets, DaemonSets, ReplicaSets, and ReplicationControllers. These should be the same charts that we show on the Pods page: Memory, CPU, Filesystem, Network In and Out. Currently, in the 4.7 release, this was only completed for the Pods page.
Goal
Present options including multi-line charts across workloads Details pages or some other representation.
Design for 4.8 release (MVP)
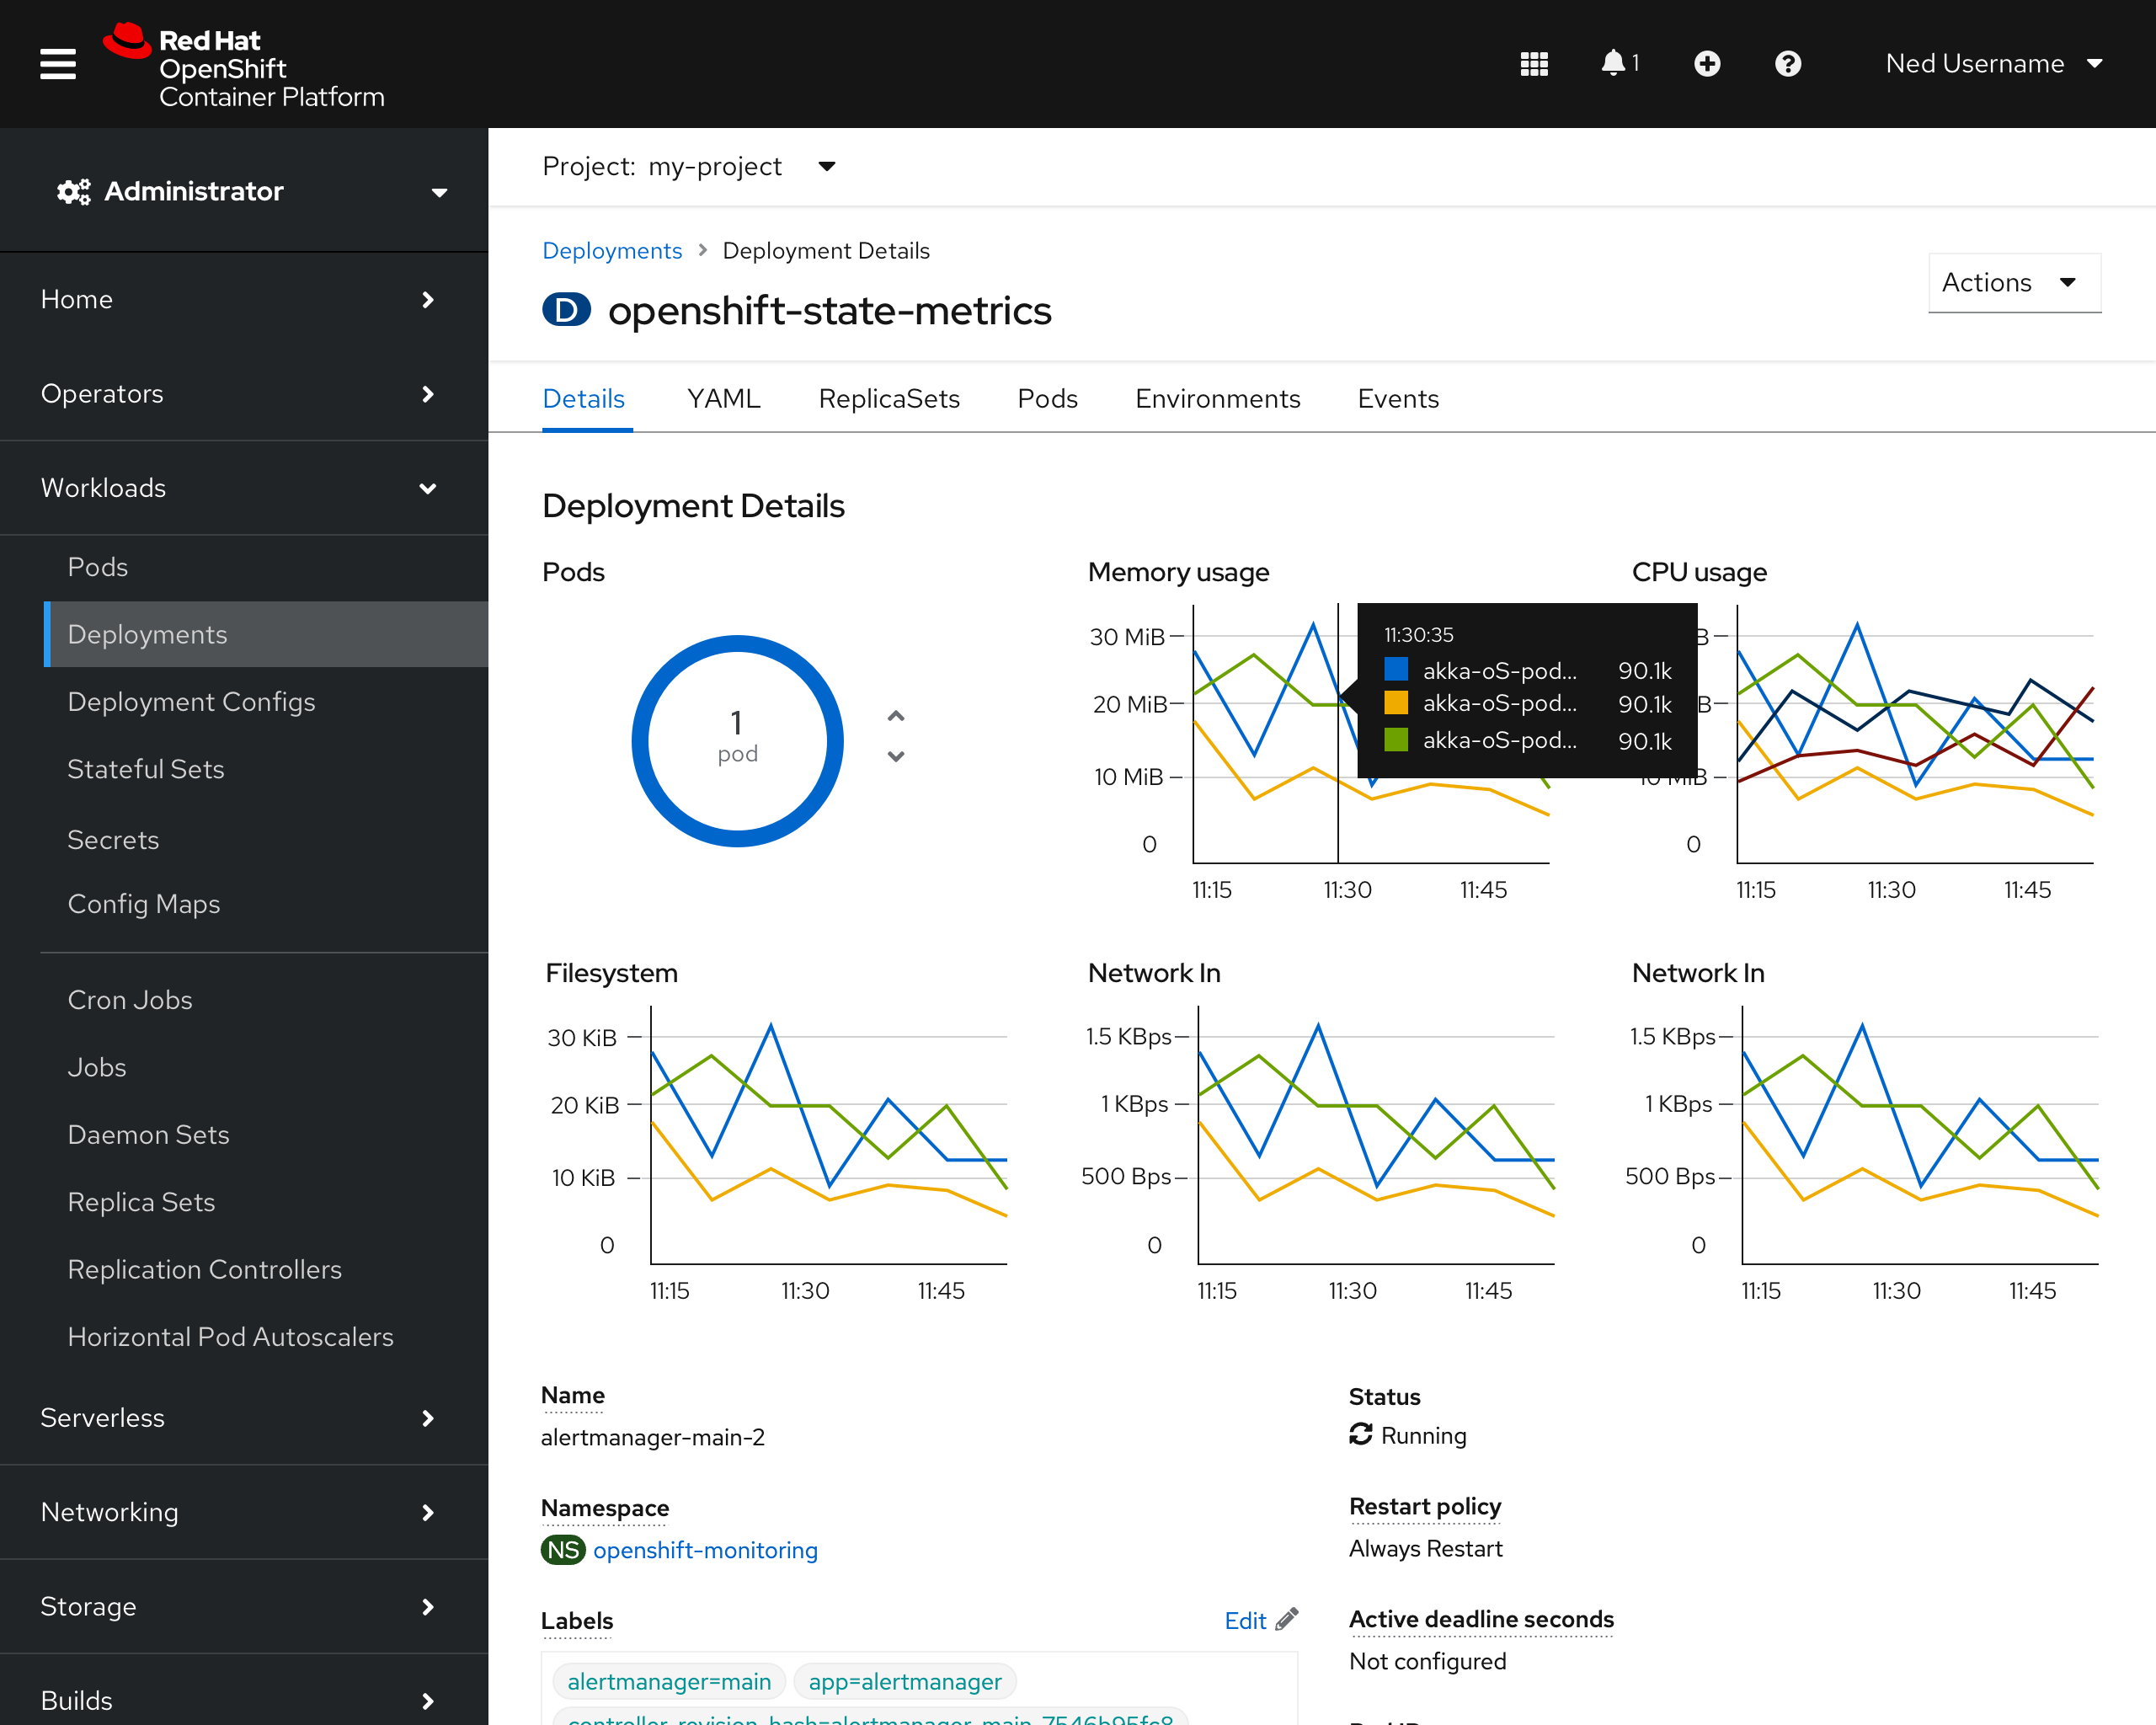
The first screenshot (below) introduces multi-line charts on a Deployments page. The Pods view remains the first option as it is an interactive feature that allows users to scale pods within a deployment. The multi-line charts have a tooltip available on hover that can click through to a Grafana metrics view.

The second screenshot includes a tooltip hover state on a chart to help distinguish between datasets. This tooltip should use a side arrow (carrot) and float beyond the bounding box of the chart in order to uncover the data as much as possible.
